Market Outlook
October 18, 2016
Market Cues
Domestic Indices
Chg (%)
(Pts)
(Close)
Indian markets are likely to open positive tracking Asian markets and SGX Nifty.
BSE Sensex
(0.5)
(144)
27,530
Nifty
(0.7)
(63)
8,520
U.S. markets finished lower Monday as warnings about accelerating inflation
Mid Cap
(0.9)
(127)
13,292
coupled with crude-oil trading below $50 a barrel overshadowed strong earnings
Small Cap
(0.5)
(69)
13,108
from Bank of America Corp.
Bankex
0.5
110
21,826
European markets traded in negative territory of the majority of Monday's session
and finished the day with moderate losses. Investors were in a cautious mood ahead
Global Indices
Chg (%)
(Pts)
(Close)
of the European Central Bank policy decision on Thursday.
Dow Jones
(0.3)
(52)
18,086
Indian markets fell on Monday, tracking weak cues from Asia and Europe, as a
Nasdaq
(0.3)
(14)
5,200
cautious mood prevailed ahead of earnings, key Chinese data and the ECB's
monetary policy decision due later this week.
FTSE
(0.9)
(66)
6,948
Nikkei
0.3
44
16,900
News Analysis
Hang Seng
(0.8)
(196)
23,038
Result review: Lakshmi Vilas Bank
Shanghai Com
(0.7)
(23)
3,041
Detailed analysis on Pg2
Advances / Declines
BSE
NSE
Investor’s Ready Reckoner
Advances
1,281
675
Key Domestic & Global Indicators
Declines
1,545
973
Stock Watch: Latest investment recommendations on 150+ stocks
Unchanged
169
79
Refer Pg6 onwards
Top Picks
Volumes (` Cr)
CMP
Target
Upside
Company
Sector
Rating
(`)
(`)
(%)
BSE
3,884
Amara Raja Batteries Auto & Auto Ancill.
Buy
1,018
1,218
19.6
NSE
20,836
HCL Tech
IT
Buy
809
1,000
23.6
Bharat Electronics
Capital Goods
Accumulate
1,265
1,414
11.8
Net Inflows (` Cr)
Net
Mtd
Ytd
Equitas Holdings
Financials
Buy
180
235
30.4
Navkar Corporation Others
Buy
197
265
34.5
FII
(945)
(582)
49,423
More Top Picks on Pg4
MFs
159
2,266
16,213
Key Upcoming Events
Previous
Consensus
Top Gainers
Price (`)
Chg (%)
Date
Region
Event Description
Reading
Expectations
Gvkpil
7
10.4
Oct 18 US
Consumer Price Index (MoM)
0.20
0.30
Icicibank
259
6.9
Oct 18 US
Building permits
1,152.00
1,165.00
Aban
277
6.2
Oct 19 UK
CPI (YoY)
0.60
0.90
Oct 19 US
Housing Starts
1,142.00
1,175.00
Gmdcltd
103
6.2
Oct 19 UK
Jobless claims change
2.40
3.15
Raymond
611
4.7
Oct 19 China
Industrial Production (YoY)
6.30
6.40
Oct 19 China
Real GDP (YoY)
6.70
6.70
6.(
Top Losers
Price (`)
Chg (%)
More Events on Pg5
Niittech
411
(6.5)
Ceatltd
1,287
(6.4)
M&Mfin
351
(5.5)
Mrf
49,842
(4.9)
Zeel
503
(4.7)
As on October 17, 2016
Market Outlook
October 18, 2016
News Analysis
Lakshmi Vilas Bank net profit up 45% at `65cr
Lakshmi Vilas Bank has posted a 44.6% growth in net profit at `64.8cr during the
quarter ended September 30, 2016, as compared to the net profit of `44.8cr
during the corresponding quarter of previous fiscal year. The total income grew by
19% to `830.3cr during the quarter, as against `697.9cr posted during the
corresponding quarter of previous fiscal year. According to management, the cost
of funding has been declining in the past months. Decrease in overall interest rates
and increase in other income have helped the bank post better numbers.
Non-performing assets surged due to a bill discounting fraud of `75cr and
slippage of an account of a food processing unit to the tune of `61cr. The gross
NPA stood at `546.1cr (2.70 as a percentage) during the quarter as compared to
` 331.8cr (1.89%) during the corresponding quarter. The net NPA increased to
`376.06cr (1.87 as a percentage) as against `175.61 (1.01%) during the same
quarter last year.
Economic and Political News
Govt approves `234cr project for ferry services in Gujarat
Indo-Pak tensions hit Pakistan's cotton trade
Tea Board freezes new e-auction settlement
Corporate News
Vedanta's power units operate at low capacity on weak demand
UltraTech Cement Q2 net profit up 25% at `613.64cr
Sybly Industries' Q2 sales up 48%
Quarterly Bloomberg Brokers Consensus Estimate
LIC Housing Finance Ltd - October 20, 2016
Particulars ( ` cr)
2QFY17E
2QFY16
y-o-y (%)
1QFY17
q-o-q (%)
Net profit
455
412
10.6
408
11.6
ACC Ltd - Oct 21, 2016
Particulars ( ` cr)
3QCY16E
3QCY15
y-o-y (%)
2QCY16
q-o-q (%)
Net sales
3,033
2,740
10.7
2,870
5.7
EBITDA
451
314
43.7
457
(1.3)
EBITDA margin (%)
14.9
11.4
15.9
Net profit
245
117
109.7
238
3.2
Wipro Ltd Consol - Oct 21, 2016
Particulars ( ` cr)
2QFY17E
2QFY16
y-o-y (%)
1QFY17
q-o-q (%)
Net sales
13,788
12,514
10.2
13,599
1.4
EBITDA
2,811
2,729
3.0
2,653
6.0
EBITDA margin (%)
20.4
21.8
19.5
Net profit
2,168
2,241
(3.2)
2,052
5.7
Market Outlook
October 18, 2016
Top Picks ★★★★★
Large Cap
Market Cap
CMP
Target
Upside
Company
Rationale
(` Cr)
(`)
(`)
(%)
To outpace battery industry growth due to better technological
Amara Raja Batteries
17,395
1,018
1,218
19.6
products leading to market share gains in both the
automotive OEM and replacement segments.
Uptick in defense capex by government when coupled with
Bharat Electronics
30,354
1,265
1,414
11.8
BELs strong market positioning, indicate that good times are
ahead for BEL.
The stock is trading at attractive valuations and is factoring all
HCL Tech
1,14,130
809
1,000
23.6
the bad news.
Back on the growth trend, expect a long term growth of 14%
Infosys
2,34,759
1,022
1,370
34.0
to be a US$20bn in FY2020.
Source: Company, Angel Research
Mid Cap
Market Cap
CMP
Target
Upside
Company
Rationale
(` Cr)
(`)
(`)
(%)
Among the top 4 players in the consumer durables segment.
Bajaj Electricals
2,604
258
306
18.8
Improved profitability backed by turn around in E&P
segment. Strong order book lends earnings visibility.
With a focus on the low and medium income (LMI) consumer
Dewan Housing Finance
8,968
307
350
13.9
segment, the company has increased its presence in tier-II &
III cities where the growth opportunity is immense.
Strong loan growth backed by diversified loan portfolio and
adequate CAR. ROE & ROA likely to remain decent as risk of
Equitas Holdings
6,042
180
235
30.4
dilution remains low. Attractive valuations considering
growth.
Economic recovery to have favourable impact on advertising
& circulation revenue growth. Further, the acquisition of a
Jagran Prakashan
6,556
201
225
12.2
radio business (Radio City) would also boost the company's
revenue growth.
Speedier execution and speedier sales, strong revenue
Mahindra Lifespace
1,771
432
522
20.9
visibilty in short-to-long run, attractive valuations
Massive capacity expansion along with rail advantage at ICD
Navkar Corporation
2,810
197
265
34.5
as well CFS augurs well for the company
Market leadership in Hindi news genre and no. 2 viewership
ranking in English news genre, exit from the radio business,
TV Today Network
1,925
323
363
12.5
and anticipated growth in ad spends by corporates to benefit
the stock.
Source: Company, Angel Research
Market Outlook
October 18, 2016
Key Upcoming Events
Result Calendar
Date
Company
October 19, 2016 KPIT Cummins, NIIT, Hind. Zinc
October 20, 2016 LIC Housing Fin.
October 21, 2016 ACC, Wipro, Mindtree, Cairn India, Kirloskar Engines India Ltd
October 22, 2016 Persistent, L G Balakrishnan & Bros
October 24, 2016 Axis Bank
October 25, 2016 HDFC Bank, Kotak Mah. Bank, Asian Paints, Dr Reddy's
October 26, 2016 Exide Industries, LMW, HDFC, Dabur India, Cadila Healthcare, Indoco Remedies
Source: Bloomberg, Angel Research
Global economic events release calendar
Bloomberg Data
Date
Time
Country Event Description
Unit
Period
Last Reported Estimated
Oct 18, 2016
6:00 PM
US Consumer price index (mom)
% Change Sep
0.20
0.30
6:00 PM
US
Building permits
Thousands Sep
1,152.00
1,165.00
Oct 19, 2016
2:00 PM
UK
CPI (YoY)
% Change Sep
0.60
0.90
6:00 PM
US
Housing Starts
Thousands Sep
1,142.00
1,175.00
2:00 PM
UK
Jobless claims change
% Change Sep
2.40
3.15
7:30 AM
China
Industrial Production (YoY)
% Change Sep
6.30
6.40
7:30 AM
China
Real GDP (YoY)
% Change 3Q
6.70
6.70
Oct 20, 2016
6:00 PM
US
Initial Jobless claims
Thousands Oct 15
246.00
250.00
7:30 PM
US
Existing home sales
Million
Sep
5.33
5.35
5:15 PM Euro Zone
ECB announces interest rates
% Oct 20
-
-
Oct 21, 2016
7:30 PM Euro ZoneEuro-Zone Consumer Confidence
Value Oct A
(8.20)
(8.00)
Oct 24, 2016
1:00 PM Germany
PMI Services
Value Oct P
50.90
1:00 PM Germany
PMI Manufacturing
Value Oct P
54.30
Oct 25, 2016
7:30 PM
US
New home sales
Thousands Sep
609.00
604.00
Oct 26, 2016
7:30 PM
US
Consumer Confidence S.A./ 1985=100 Oct
104.10
100.50
Oct 27, 2016
2:00 PM
UK
GDP (YoY)
% Change 3Q A
2.10
Oct 28, 2016
6:00 PM
US
GDP Qoq (Annualised)
% Change 3Q A
1.40
2.50
Source: Bloomberg, Angel Research
Market Outlook
October 18, 2016
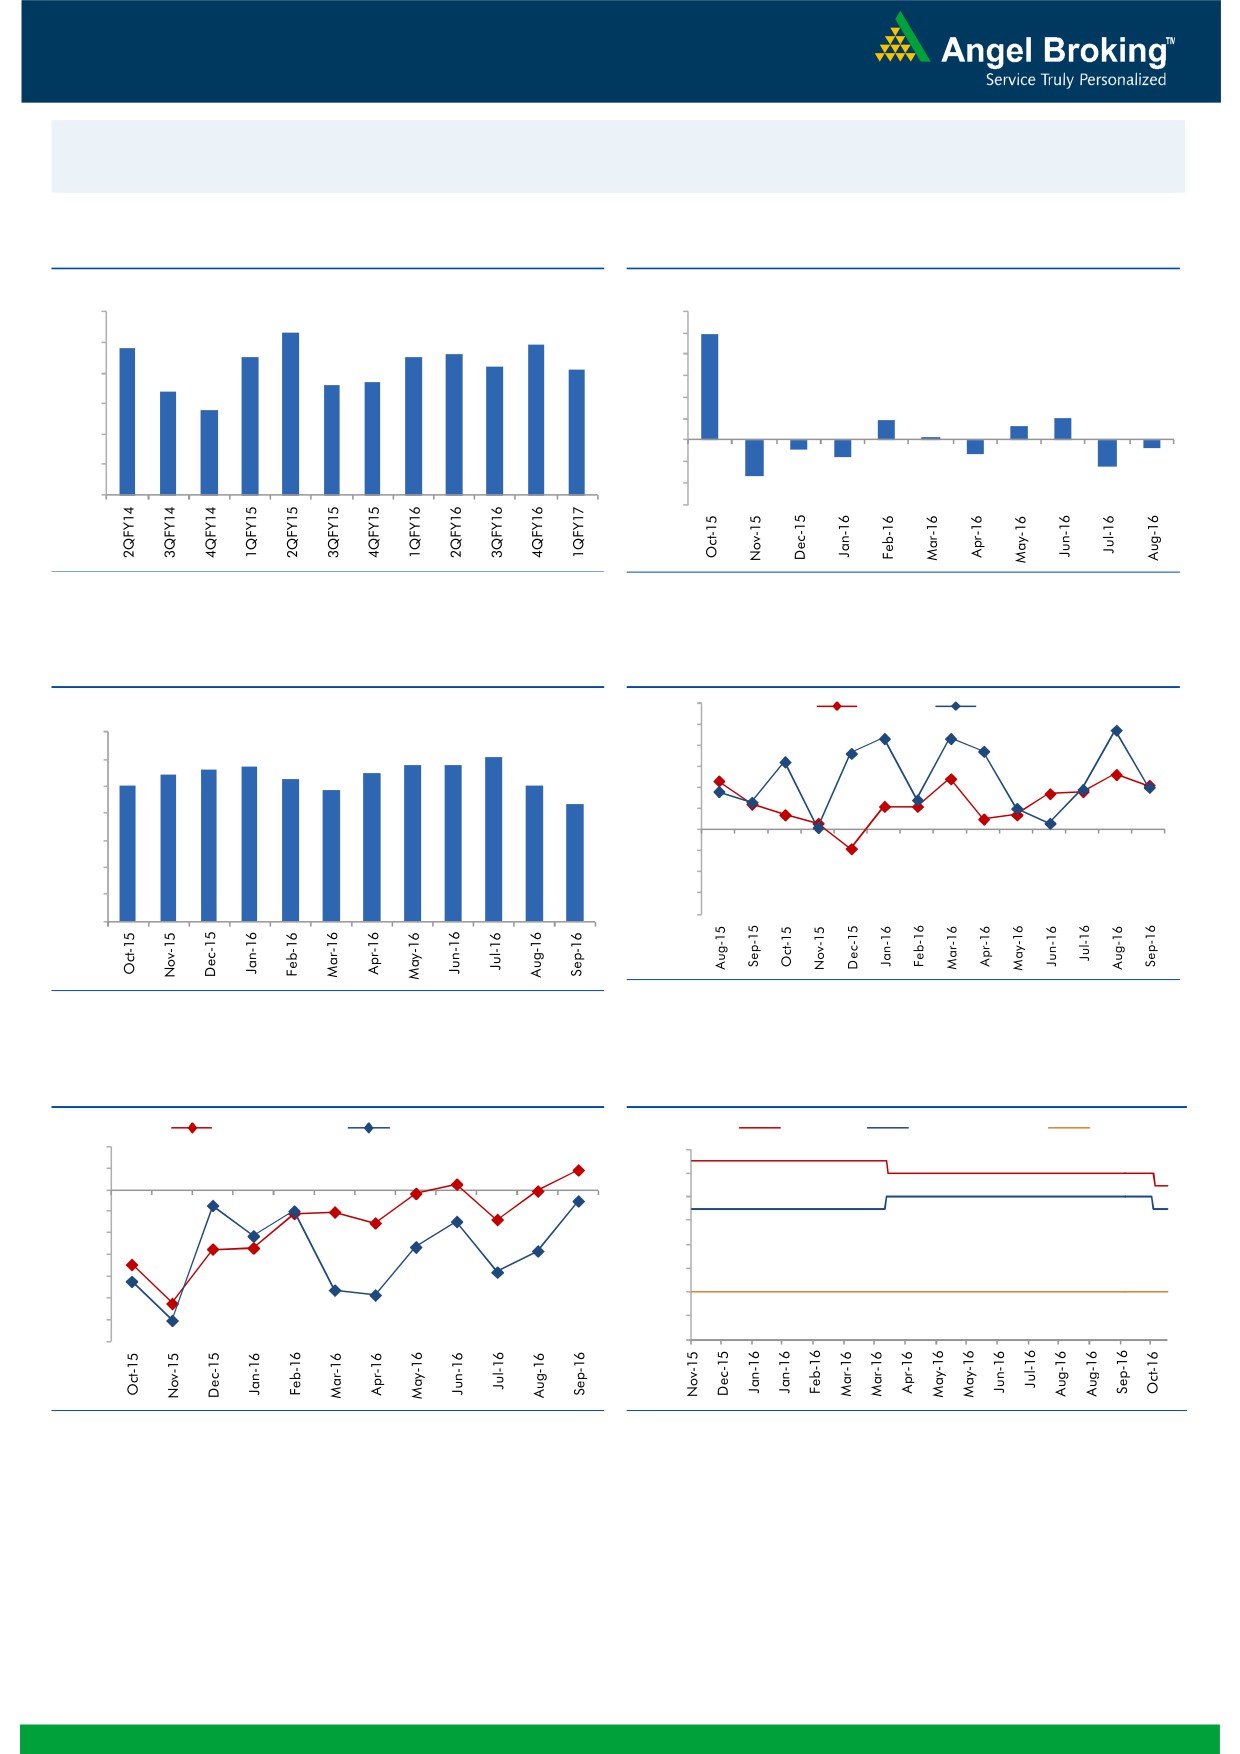
Macro watch
Exhibit 1: Quarterly GDP trends
Exhibit 2: IIP trends
(%)
(%)
9.0
8.3
12.0
9.9
7.8
7.9
10.0
8.0
7.5
7.5
7.6
7.2
7.1
8.0
6.6
6.7
7.0
6.4
6.0
5.8
6.0
4.0
1.9
2.0
1.3
2.0
0.3
5.0
-
4.0
(2.0)
(0.7)
(0.9)
(1.6)
(1.3)
(4.0)
(2.5)
3.0
(3.4)
(6.0)
Source: CSO, Angel Research
Source: MOSPI, Angel Research
Exhibit 3: Monthly CPI inflation trends
Exhibit 4: Manufacturing and services PMI
56.0
Mfg. PMI
Services PMI
(%)
55.0
7.0
6.1
5.7
5.8
5.8
54.0
5.6
5.5
6.0
5.4
5.3
5.0
5.1
53.0
4.8
5.0
4.3
52.0
4.0
51.0
50.0
3.0
49.0
2.0
48.0
1.0
47.0
46.0
-
Source: Market, Angel Research; Note: Level above 50 indicates expansion
Source: MOSPI, Angel Research
Exhibit 5: Exports and imports growth trends
Exhibit 6: Key policy rates
(%)
Exports yoy growth
Imports yoy growth
(%)
Repo rate
Reverse Repo rate
CRR
10.0
7.00
5.0
6.50
0.0
6.00
(5.0)
5.50
(10.0)
5.00
(15.0)
4.50
(20.0)
4.00
(25.0)
(30.0)
3.50
(35.0)
3.00
Source: Bloomberg, Angel Research
Source: RBI, Angel Research
Market Outlook
October 18, 2016
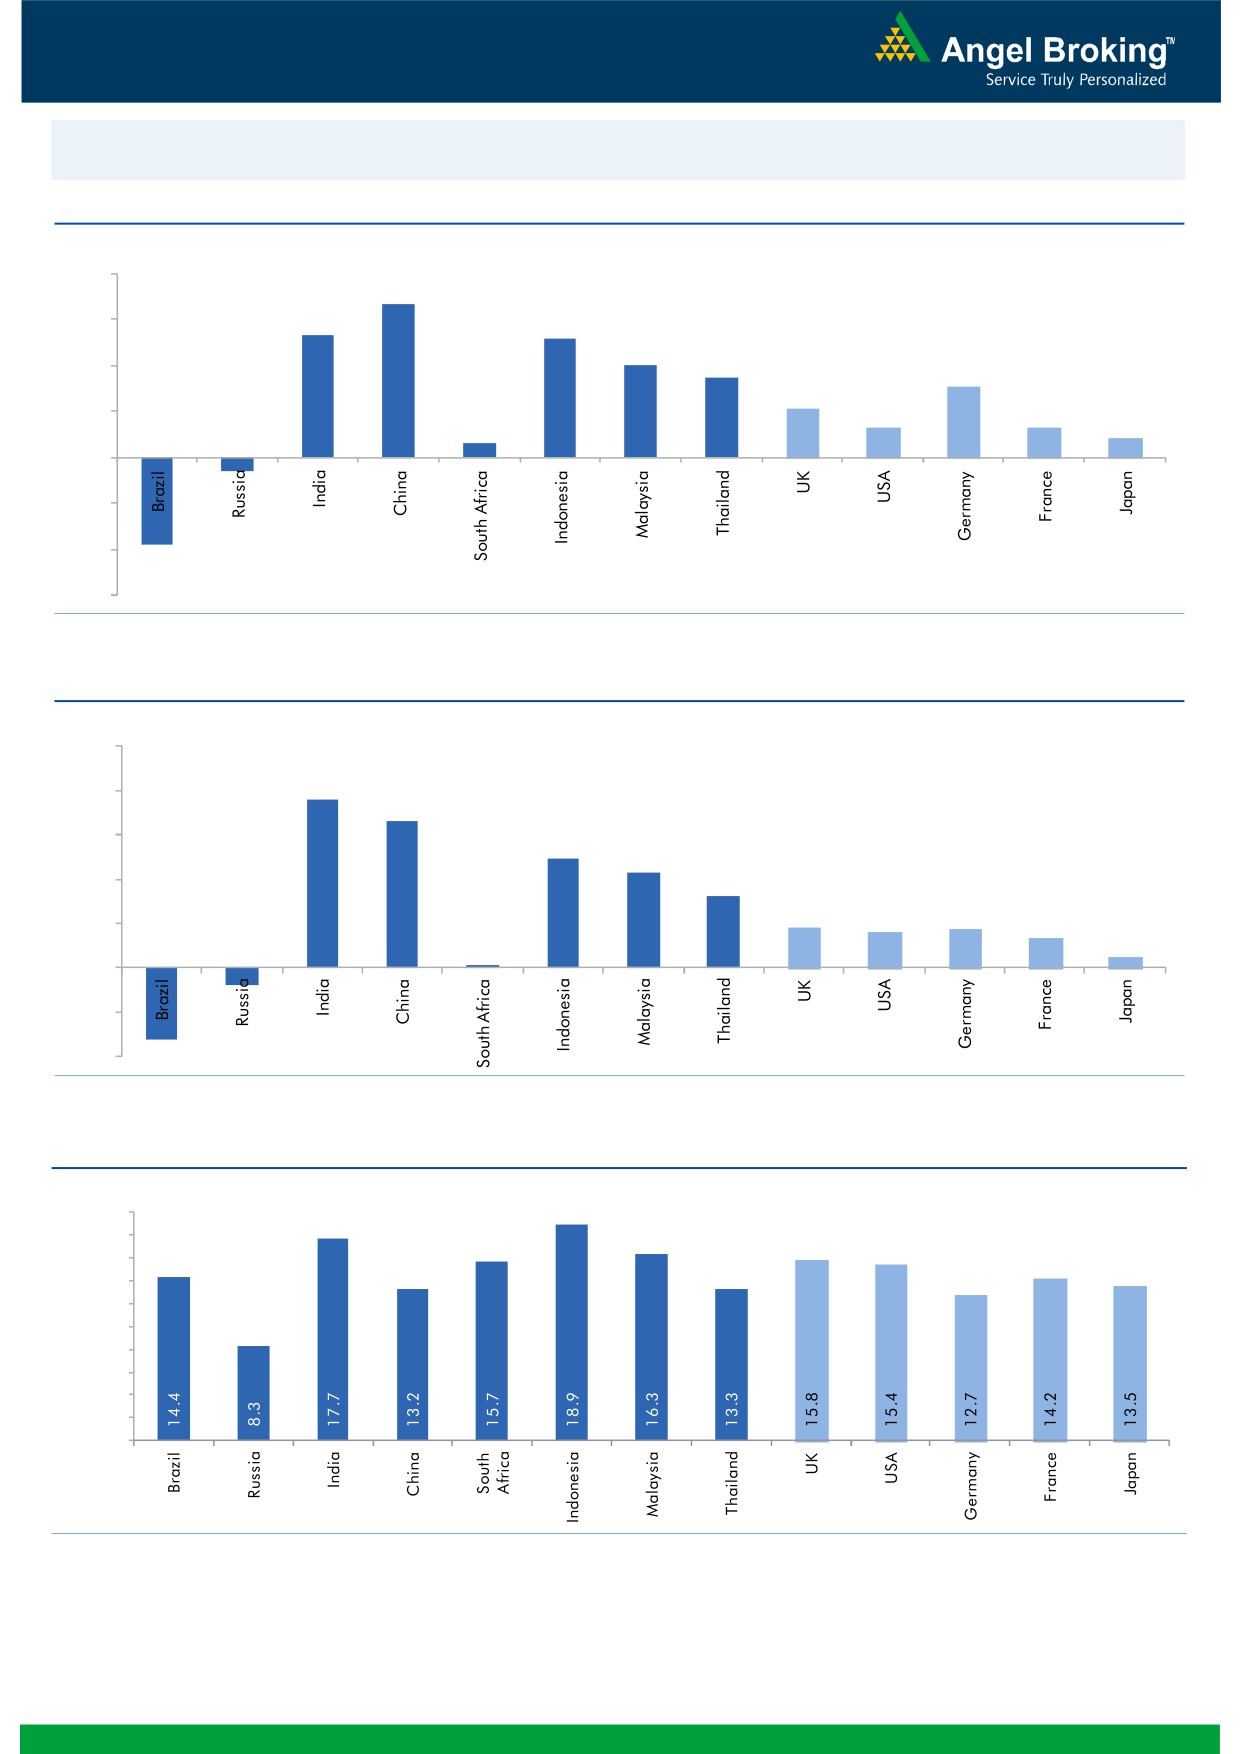
Global watch
Exhibit 1: Latest quarterly GDP Growth (%, yoy) across select developing and developed countries
(%)
8.0
6.7
6.0
5.3
0.6
5.2
4.0
3.5
4.0
3.1
2.1
2.0
1.3
1.3
0.8
-
(2.0)
(0.6)
(4.0)
(3.8)
(6.0)
Source: Bloomberg, Angel Research
Exhibit 2: 2016 GDP Growth projection by IMF (%, yoy) across select developing and developed countries
(%)
10.0
7.6
8.0
6.6
6.0
4.9
4.3
4.0
3.2
1.8
1.7
1.6
2.0
1.3
(0.8)
0.5
(3.3)
0.1
-
(2.0)
(4.0)
Source: IMF, Angel Research
Exhibit 3: One year forward P-E ratio across select developing and developed countries
(x)
20.0
18.0
16.0
14.0
12.0
10.0
8.0
6.0
4.0
2.0
-
Source: IMF, Angel Research
Market Outlook
October 18, 2016
Exhibit 4: Relative performance of indices across globe
Returns (%)
Country
Name of index
Closing price
1M
3M
1YR
Brazil
Bovespa
62,696
9.9
12.8
27.1
Russia
Micex
1,957
(2.0)
2.1
13.0
India
Nifty
8,520
(2.2)
(0.0)
4.2
China
Shanghai Composite
3,041
(1.5)
1.7
(3.1)
South Africa
Top 40
44,253
(3.2)
(4.7)
(6.8)
Mexico
Mexbol
47,657
4.1
1.5
7.0
Indonesia
LQ45
933
2.8
6.4
22.9
Malaysia
KLCI
1,654
(1.4)
(0.4)
(2.1)
Thailand
SET 50
940
0.8
(0.3)
5.8
USA
Dow Jones
18,086
(0.7)
(2.4)
5.0
UK
FTSE
6,948
3.2
3.8
9.5
Japan
Nikkei
16,900
1.4
5.0
(7.1)
Germany
DAX
10,504
1.2
4.4
3.5
France
CAC
4,450
1.8
2.8
(9.1)
Source: Bloomberg, Angel Research
Stock Watch
October 18, 2016
Company Name
Reco
CMP
Target
Mkt Cap
Sales ( Čcr )
OPM(%)
EPS (Č)
PER(x)
P/BV(x)
RoE(%)
EV/Sales(x)
(Č)
Price ( Č)
( Č cr )
FY17E FY18E
FY17E
FY18E
FY17E
FY18E
FY17E
FY18E
FY17E
FY18E
FY17E
FY18E
FY17E
FY18E
Agri / Agri Chemical
Rallis
Neutral
229
-
4,453
1,937
2,164
13.3
14.3
9.0
11.0
25.4
20.8
4.4
3.9
18.4
19.8
2.3
2.1
United Phosphorus
Neutral
687
-
34,800
15,176
17,604
18.5
18.5
37.4
44.6
18.4
15.4
3.6
3.0
21.4
21.2
2.4
2.0
Auto & Auto Ancillary
Ashok Leyland
Buy
81
111
23,180
22,407
26,022
10.6
10.6
5.2
6.4
15.6
12.7
3.5
3.0
23.6
24.7
1.1
0.9
Bajaj Auto
Neutral
2,754
-
79,700
25,093
27,891
19.5
19.2
143.9
162.5
19.1
17.0
5.4
4.6
30.3
29.4
2.9
2.5
Bharat Forge
Neutral
891
-
20,733
7,726
8,713
20.5
21.2
35.3
42.7
25.2
20.9
4.7
4.2
18.9
20.1
2.7
2.4
Eicher Motors
Neutral
24,647
-
66,945
16,583
20,447
17.5
18.0
598.0
745.2
41.2
33.1
14.1
10.7
41.2
38.3
3.9
3.1
Gabriel India
Accumulate
118
130
1,689
1,544
1,715
9.0
9.3
5.4
6.3
21.8
18.7
4.1
3.6
18.9
19.5
1.0
0.9
Hero Motocorp
Neutral
3,404
-
67,977
31,253
35,198
15.3
15.0
172.3
192.1
19.8
17.7
7.2
6.2
38.9
37.0
2.1
1.8
Jamna Auto Industries Neutral
215
-
1,719
1,486
1,620
9.8
9.9
15.0
17.2
14.4
12.5
3.1
2.7
21.8
21.3
1.2
1.1
L G Balakrishnan & Bros Neutral
592
-
929
1,302
1,432
11.6
11.9
43.7
53.0
13.6
11.2
1.9
1.7
13.8
14.2
0.8
0.7
Mahindra and Mahindra Neutral
1,313
-
81,574
46,534
53,077
11.6
11.7
67.3
78.1
19.5
16.8
3.2
2.8
15.4
15.8
1.7
1.5
Maruti
Accumulate
5,600
5,998
169,163
69,186
82,217
14.7
14.4
198.5
241.4
28.2
23.2
5.5
4.5
20.2
20.0
2.1
1.7
Minda Industries
Neutral
335
-
2,661
2,728
3,042
9.0
9.1
68.2
86.2
4.9
3.9
1.1
0.9
23.8
24.3
1.0
0.9
Motherson Sumi
Neutral
322
-
45,224
45,896
53,687
7.8
8.3
13.0
16.1
24.7
20.0
8.0
6.4
34.7
35.4
1.1
0.9
Rane Brake Lining
Neutral
1,257
-
995
511
562
11.3
11.5
28.1
30.9
44.7
40.7
6.8
6.2
15.3
15.0
2.1
1.9
Setco Automotive
Neutral
42
-
556
741
837
13.0
13.0
15.2
17.0
2.7
2.4
0.4
0.4
15.8
16.3
1.1
1.0
Tata Motors
Neutral
547
-
157,944
300,209
338,549
8.9
8.4
42.7
54.3
12.8
10.1
2.1
1.7
15.6
17.2
0.6
0.6
TVS Motor
Neutral
388
-
18,448
13,390
15,948
6.9
7.1
12.8
16.5
30.4
23.5
7.6
6.0
26.3
27.2
1.4
1.2
Amara Raja Batteries
Buy
1,018
1,218
17,395
5,429
6,471
17.5
17.6
35.3
43.5
28.9
23.4
6.6
5.4
25.3
24.8
3.1
2.5
Exide Industries
Neutral
185
-
15,746
7,439
8,307
15.0
15.0
8.1
9.3
22.9
19.9
3.2
2.9
14.3
16.7
1.7
1.5
Apollo Tyres
Accumulate
209
235
10,639
12,877
14,504
14.3
13.9
21.4
23.0
9.8
9.1
1.5
1.3
16.4
15.2
1.0
0.9
Ceat
Accumulate
1,287
1,450
5,204
7,524
8,624
13.0
12.7
131.1
144.3
9.8
8.9
1.8
1.5
19.8
18.6
0.8
0.7
JK Tyres
Neutral
151
-
3,421
7,455
8,056
15.0
15.0
21.8
24.5
6.9
6.2
1.4
1.2
22.8
21.3
0.6
0.5
Swaraj Engines
Neutral
1,359
-
1,688
660
810
15.2
16.4
54.5
72.8
24.9
18.7
7.8
7.1
31.5
39.2
2.4
1.9
Subros
Neutral
132
-
792
1,488
1,681
11.7
11.9
6.4
7.2
20.6
18.4
2.2
2.0
10.8
11.4
0.8
0.7
Indag Rubber
Neutral
197
-
516
286
326
19.8
16.8
11.7
13.3
16.8
14.8
2.8
2.7
17.8
17.1
1.5
1.3
Capital Goods
ACE
Neutral
44
-
430
709
814
4.1
4.6
1.4
2.1
31.1
20.7
1.3
1.2
4.4
6.0
0.8
0.7
BEML
Buy
927
1,157
3,862
3,451
4,055
6.3
9.2
31.4
57.9
29.5
16.0
1.8
1.6
6.3
10.9
1.2
1.0
Bharat Electronics
Accumulate
1,265
1,414
30,354
8,137
9,169
16.8
17.2
58.7
62.5
21.6
20.2
3.3
3.0
44.6
46.3
2.7
2.4
Stock Watch
October 18, 2016
Company Name
Reco
CMP
Target
Mkt Cap
Sales ( Čcr )
OPM(%)
EPS (Č)
PER(x)
P/BV(x)
RoE(%)
EV/Sales(x)
(Č)
Price ( Č)
( Č cr )
FY17E
FY18E
FY17E
FY18E
FY17E
FY18E
FY17E
FY18E
FY17E
FY18E
FY17E
FY18E
FY17E
FY18E
Capital Goods
Voltas
Neutral
392
-
12,964
6,511
7,514
7.9
8.7
12.9
16.3
30.4
24.0
5.5
4.8
16.7
18.5
1.7
1.5
BGR Energy
Neutral
114
-
823
16,567
33,848
6.0
5.6
7.8
5.9
14.6
19.3
0.8
0.8
4.7
4.2
0.2
0.1
BHEL
Neutral
132
-
32,247
28,797
34,742
-
2.8
2.3
6.9
57.3
19.1
1.0
0.9
1.3
4.8
0.8
0.5
Blue Star
Accumulate
572
634
5,459
4,283
5,077
5.9
7.3
14.9
22.1
38.5
25.9
7.5
6.3
20.4
26.4
1.3
1.1
Crompton Greaves
Neutral
74
-
4,654
5,777
6,120
5.9
7.0
3.3
4.5
22.5
16.5
1.0
0.9
4.4
5.9
0.8
0.6
Greaves Cotton
Neutral
127
-
3,090
1,755
1,881
16.8
16.9
7.8
8.5
16.2
14.9
3.2
3.0
20.6
20.9
1.5
1.3
Inox Wind
Buy
226
286
5,023
5,605
6,267
15.7
16.4
24.8
30.0
9.1
7.5
2.5
1.9
25.9
24.4
0.9
0.8
KEC International
Neutral
125
-
3,221
9,294
10,186
7.9
8.1
9.9
11.9
12.7
10.5
1.9
1.6
15.6
16.3
0.6
0.5
Thermax
Neutral
873
-
10,396
5,421
5,940
7.3
7.3
25.7
30.2
34.0
28.9
4.1
3.8
12.2
13.1
1.8
1.7
VATech Wabag
Buy
553
681
3,015
3,136
3,845
8.9
9.1
26.0
35.9
21.3
15.4
2.7
2.3
13.4
15.9
0.9
0.7
Cement
ACC
Neutral
1,605
-
30,147
11,225
13,172
13.2
16.9
44.5
75.5
36.1
21.3
3.4
3.2
11.2
14.2
2.7
2.3
Ambuja Cements
Neutral
246
-
48,936
9,350
10,979
18.2
22.5
5.8
9.5
42.5
25.9
3.6
3.2
10.2
12.5
5.2
4.5
India Cements
Neutral
154
-
4,717
4,364
4,997
18.5
19.2
7.9
11.3
19.4
13.6
1.4
1.4
8.0
8.5
1.8
1.6
JK Cement
Neutral
946
-
6,618
4,398
5,173
15.5
17.5
31.2
55.5
30.3
17.1
3.6
3.2
12.0
15.5
2.1
1.7
J K Lakshmi Cement
Buy
484
565
5,696
2,913
3,412
14.5
19.5
7.5
22.5
64.5
21.5
4.0
3.3
12.5
18.0
2.5
2.1
Orient Cement
Accumulate
187
215
3,838
2,114
2,558
18.5
20.5
8.1
11.3
23.1
16.6
3.4
2.9
9.0
14.0
2.4
1.9
UltraTech Cement
Neutral
4,009
-
110,014
25,768
30,385
21.0
23.5
111.0
160.0
36.1
25.1
4.6
4.0
13.5
15.8
4.4
3.6
Construction
ITNL
Neutral
103
-
3,383
8,946
10,017
31.0
31.6
8.1
9.1
12.7
11.3
0.5
0.5
4.2
5.0
3.7
3.4
KNR Constructions
Neutral
782
-
2,198
1,385
1,673
14.7
14.0
41.2
48.5
19.0
16.1
3.5
3.1
14.9
15.2
1.7
1.4
Larsen & Toubro
Buy
1,447
1,700
134,890
67,665
77,249
10.7
11.5
57.3
71.2
25.3
20.3
2.3
2.2
12.6
14.3
2.2
1.9
Gujarat Pipavav Port
Neutral
174
-
8,405
705
788
52.2
51.7
5.0
5.6
34.8
31.0
3.4
3.1
11.2
11.2
11.6
9.9
Nagarjuna Const.
Neutral
80
-
4,447
8,842
9,775
9.1
8.8
5.3
6.4
15.1
12.5
1.2
1.1
8.2
9.1
0.7
0.6
PNC Infratech
Buy
123
143
3,167
2,350
2,904
13.1
13.2
9.0
8.8
13.7
14.0
0.5
0.4
15.9
13.9
1.5
1.2
Simplex Infra
Neutral
334
-
1,655
6,829
7,954
10.5
10.5
31.4
37.4
10.7
8.9
1.1
1.0
9.9
13.4
0.7
0.6
Power Mech Projects
Neutral
480
-
706
1,801
2,219
12.7
14.6
72.1
113.9
6.7
4.2
1.2
1.0
16.8
11.9
0.4
0.3
Sadbhav Engineering
Accumulate
271
298
4,649
3,598
4,140
10.3
10.6
9.0
11.9
30.1
22.8
3.2
2.8
9.9
11.9
1.6
1.3
NBCC
Neutral
250
-
15,012
7,428
9,549
7.9
8.6
8.2
11.0
30.5
22.8
1.5
1.2
28.2
28.7
1.7
1.3
MEP Infra
Neutral
43
-
693
1,877
1,943
30.6
29.8
3.0
4.2
14.2
10.2
6.9
4.6
0.6
0.6
1.8
1.6
SIPL
Neutral
109
-
3,825
1,036
1,252
65.5
66.2
(8.4)
(5.6)
4.1
4.6
(22.8)
(15.9)
11.9
9.9
Stock Watch
October 18, 2016
Company Name
Reco
CMP
Target
Mkt Cap
Sales ( Čcr )
OPM(%)
EPS (Č)
PER(x)
P/BV(x)
RoE(%)
EV/Sales(x)
(Č)
Price ( Č)
( Č cr )
FY17E
FY18E
FY17E
FY18E
FY17E
FY18E
FY17E
FY18E
FY17E
FY18E
FY17E
FY18E
FY17E
FY18E
Construction
Engineers India
Neutral
256
-
8,622
1,725
1,935
16.0
19.1
11.4
13.9
22.5
18.4
3.1
3.0
13.4
15.3
3.9
3.5
Financials
Axis Bank
Buy
519
630
123,837
46,932
53,575
3.5
3.4
32.4
44.6
16.0
11.6
2.1
1.8
13.6
16.5
-
-
Bank of Baroda
Neutral
151
-
34,770
19,980
23,178
1.8
1.8
11.5
17.3
13.1
8.7
1.5
1.2
8.3
10.1
-
-
Canara Bank
Neutral
305
-
16,569
15,225
16,836
1.8
1.8
14.5
28.0
21.0
10.9
1.5
1.2
5.8
8.5
-
-
Dewan Housing Finance Accumulate
307
350
8,968
2,225
2,688
2.9
2.9
29.7
34.6
10.4
8.9
1.7
1.4
16.1
16.8
-
-
Equitas Holdings
Buy
180
235
6,042
939
1,281
11.7
11.5
5.8
8.2
31.1
22.0
2.7
2.4
10.9
11.5
-
-
Federal Bank
Neutral
70
-
12,010
9,353
10,623
2.9
2.9
4.4
5.8
15.9
12.1
1.5
1.3
9.5
11.0
-
-
HDFC
Neutral
1,302
-
205,842
11,475
13,450
3.4
3.4
45.3
52.5
28.7
24.8
5.5
4.9
20.2
20.5
-
-
HDFC Bank
Accumulate
1,238
1,350
313,379
46,097
55,433
4.5
4.5
58.4
68.0
21.2
18.2
3.7
3.1
18.8
18.6
-
-
ICICI Bank
Neutral
259
-
150,397
39,029
45,903
3.3
3.3
16.7
16.3
15.5
15.9
1.9
1.7
10.1
12.4
-
-
LIC Housing Finance
Accumulate
578
630
29,157
3,712
4,293
2.6
2.5
39.0
46.0
14.8
12.6
2.8
2.4
19.9
20.1
-
-
Punjab Natl.Bank
Neutral
137
-
29,079
23,532
23,595
2.3
2.4
6.8
12.6
20.1
10.9
3.1
2.2
3.3
6.5
-
-
RBL Bank
Buy
308
365
11,383
1,783
2,309
2.6
2.6
12.7
16.4
24.2
18.8
2.6
2.4
12.8
13.3
-
-
South Ind.Bank
Neutral
23
-
3,146
6,435
7,578
2.5
2.5
2.7
3.1
8.6
7.5
1.1
0.9
10.1
11.2
-
-
St Bk of India
Neutral
253
-
196,476
88,650
98,335
2.6
2.6
13.5
18.8
18.8
13.5
1.8
1.6
7.0
8.5
-
-
Union Bank
Neutral
138
-
9,480
13,450
14,925
2.3
2.3
25.5
34.5
5.4
4.0
0.8
0.7
7.5
10.2
-
-
Yes Bank
Neutral
1,251
-
52,661
8,978
11,281
3.3
3.4
74.0
90.0
16.9
13.9
3.2
2.7
17.0
17.2
-
-
FMCG
Asian Paints
Neutral
1,183
-
113,464
17,128
18,978
16.8
16.4
19.1
20.7
61.9
57.1
21.6
20.3
34.8
35.5
6.5
5.9
Britannia
Accumulate
3,300
3,626
39,594
9,795
11,040
14.6
14.9
80.3
94.0
41.1
35.1
16.9
13.1
41.2
-
3.9
3.4
Colgate
Accumulate
913
995
24,821
4,605
5,149
23.4
23.4
23.8
26.9
38.3
33.9
21.2
16.6
64.8
66.8
5.3
4.7
Dabur India
Accumulate
272
304
47,805
8,315
9,405
19.8
20.7
8.1
9.2
33.6
29.5
9.3
7.7
31.6
31.0
5.4
4.7
GlaxoSmith Con*
Neutral
6,196
-
26,058
4,350
4,823
21.2
21.4
179.2
196.5
34.6
31.5
9.2
7.8
27.1
26.8
5.4
4.8
Godrej Consumer
Neutral
1,566
-
53,341
10,235
11,428
18.4
18.6
41.1
44.2
38.1
35.4
8.5
7.1
24.9
24.8
5.3
4.7
HUL
Neutral
849
-
183,831
35,252
38,495
17.6
17.4
20.4
21.9
41.6
38.8
34.2
30.0
82.2
77.3
5.0
4.6
ITC
Buy
240
283
290,243
40,059
44,439
39.0
39.2
9.1
10.1
26.4
23.8
7.2
6.3
27.2
26.5
6.7
6.0
Marico
Accumulate
276
300
35,641
6,430
7,349
18.8
19.5
6.4
7.7
43.2
35.9
13.0
11.0
33.2
32.5
5.4
4.6
Nestle*
Neutral
6,772
-
65,294
10,073
11,807
20.7
21.5
124.8
154.2
54.3
43.9
22.3
20.0
34.8
36.7
6.3
5.3
Tata Global
Neutral
150
-
9,483
8,675
9,088
9.8
9.8
7.4
8.2
20.3
18.3
2.3
2.2
7.9
8.1
1.0
0.9
Procter & Gamble
Accumulate
6,992
7,369
22,695
2,939
3,342
23.2
23.0
146.2
163.7
47.8
42.7
107.1
102.7
25.3
23.5
7.3
6.3
Hygiene
Stock Watch
October 18, 2016
Company Name
Reco
CMP
Target
Mkt Cap
Sales ( Čcr )
OPM(%)
EPS (Č)
PER(x)
P/BV(x)
RoE(%)
EV/Sales(x)
(Č)
Price ( Č)
( Č cr )
FY17E FY18E
FY17E
FY18E
FY17E
FY18E
FY17E
FY18E
FY17E
FY18E
FY17E
FY18E
FY17E
FY18E
IT
HCL Tech^
Buy
809
1,000
114,130
49,242
57,168
20.5
20.5
55.7
64.1
14.5
12.6
3.0
2.3
20.3
17.9
2.2
1.8
Infosys
Buy
1,022
1,370
234,759
69,934
79,025
27.5
27.5
64.8
72.0
15.8
14.2
3.5
3.2
22.0
22.3
2.8
2.4
TCS
Buy
2,363
3,004
465,592
121,684
136,286
27.3
27.3
135.0
150.1
17.5
15.7
5.8
5.4
33.2
33.9
3.6
3.2
Tech Mahindra
Buy
407
700
39,551
30,347
33,685
17.0
17.0
37.5
41.3
10.9
9.9
2.4
2.1
21.8
20.7
1.0
0.9
Wipro
Buy
472
680
114,609
51,631
55,822
21.7
17.9
35.9
36.9
13.1
12.8
2.7
2.5
19.0
18.1
1.9
1.7
Media
D B Corp
Neutral
398
-
7,316
2,297
2,590
27.4
28.2
21.0
23.4
19.0
17.0
4.4
3.8
23.7
23.1
3.0
2.6
HT Media
Neutral
92
-
2,140
2,693
2,991
12.6
12.9
7.9
9.0
11.6
10.2
1.0
0.9
7.8
8.3
0.4
0.2
Jagran Prakashan
Accumulate
201
225
6,556
2,355
2,635
28.0
28.0
10.8
12.5
18.6
16.1
4.0
3.5
21.7
21.7
2.8
2.5
Sun TV Network
Neutral
526
-
20,743
2,850
3,265
70.1
71.0
26.2
30.4
20.1
17.3
5.1
4.5
24.3
25.6
6.9
5.9
Hindustan Media
Neutral
295
-
2,165
1,016
1,138
24.3
25.2
27.3
30.1
10.8
9.8
2.1
1.8
16.2
15.8
1.5
1.3
Ventures
TV Today Network
Accumulate
323
363
1,925
637
743
27.5
27.5
18.4
21.4
17.6
15.1
3.1
2.6
17.4
17.2
2.6
2.2
Metals & Mining
Coal India
Neutral
311
-
196,471
84,638
94,297
21.4
22.3
24.5
27.1
12.7
11.5
5.3
5.0
42.6
46.0
1.8
1.6
Hind. Zinc
Neutral
240
-
101,387
14,252
18,465
55.9
48.3
15.8
21.5
15.2
11.2
2.5
2.2
17.0
20.7
7.1
5.5
Hindalco
Neutral
151
-
31,119
107,899
112,095
7.4
8.2
9.2
13.0
16.4
11.6
0.8
0.7
4.8
6.6
0.8
0.8
JSW Steel
Neutral
1,722
-
41,627
53,201
58,779
16.1
16.2
130.6
153.7
13.2
11.2
1.8
1.6
14.0
14.4
1.5
1.3
NMDC
Neutral
115
-
45,654
6,643
7,284
44.4
47.7
7.1
7.7
16.2
15.0
1.4
1.4
8.8
9.2
4.6
4.2
SAIL
Neutral
47
-
19,535
47,528
53,738
(0.7)
2.1
(1.9)
2.6
18.2
0.5
0.5
(1.6)
3.9
1.3
1.1
Vedanta
Neutral
193
-
57,219
71,744
81,944
19.2
21.7
13.4
20.1
14.4
9.6
1.2
1.1
8.4
11.3
1.2
0.9
Tata Steel
Neutral
411
-
39,888
121,374
121,856
7.2
8.4
18.6
34.3
22.1
12.0
1.4
1.3
6.1
10.1
1.0
0.9
Oil & Gas
Cairn India
Neutral
221
-
41,509
9,127
10,632
4.3
20.6
8.8
11.7
25.2
18.9
0.8
0.8
3.3
4.2
6.0
5.0
GAIL
Neutral
428
-
54,240
56,220
65,198
9.3
10.1
27.1
33.3
15.8
12.8
1.4
1.3
9.3
10.7
1.2
1.0
ONGC
Neutral
278
-
238,228
137,222
152,563
15.0
21.8
19.5
24.1
14.3
11.6
1.2
1.2
8.5
10.1
2.0
1.8
Indian Oil Corp
Neutral
642
-
155,947
373,359
428,656
5.9
5.5
54.0
59.3
11.9
10.8
1.8
1.7
16.0
15.6
0.6
0.5
Reliance Industries
Neutral
1,060
-
343,748
301,963
358,039
12.1
12.6
87.7
101.7
12.1
10.4
1.2
1.1
10.7
11.3
1.6
1.3
Pharmaceuticals
Alembic Pharma
Neutral
682
-
12,864
3,483
4,083
20.2
21.4
24.3
30.4
28.1
22.5
6.4
5.1
25.5
25.3
3.6
3.0
Aurobindo Pharma
Accumulate
809
877
47,364
15,720
18,078
23.7
23.7
41.4
47.3
19.6
17.1
5.1
4.0
29.6
26.1
3.2
2.8
Aventis*
Neutral
4,230
-
9,741
2,357
2,692
17.3
17.3
153.5
169.2
27.6
25.0
4.7
3.8
25.8
28.4
3.8
3.1
Cadila Healthcare
Neutral
389
-
39,824
11,126
13,148
22.0
22.0
17.1
20.0
22.8
19.5
5.8
4.6
28.8
26.6
3.6
2.9
Cipla
Sell
584
490
46,965
15,378
18,089
17.4
18.4
21.6
27.2
27.1
21.5
3.5
3.1
13.7
15.2
3.3
2.7
Stock Watch
October 18, 2016
Company Name
Reco
CMP
Target
Mkt Cap
Sales ( Čcr )
OPM(%)
EPS (Č)
PER(x)
P/BV(x)
RoE(%)
EV/Sales(x)
(Č)
Price ( Č)
( Č cr )
FY17E FY18E
FY17E
FY18E
FY17E
FY18E
FY17E
FY18E
FY17E
FY18E
FY17E
FY18E
FY17E
FY18E
Pharmaceuticals
Dr Reddy's
Neutral
3,028
-
50,167
16,043
18,119
23.1
24.7
126.0
157.8
24.0
19.2
3.5
3.1
15.7
17.1
3.1
2.7
Dishman Pharma
Sell
240
45
3,880
1,718
1,890
22.7
22.8
9.5
11.3
25.3
21.3
2.5
2.2
10.1
10.9
2.7
2.4
GSK Pharma*
Neutral
2,959
-
25,064
3,528
3,811
16.6
18.8
51.8
59.4
57.1
49.8
15.3
15.2
26.3
30.6
6.9
6.4
Indoco Remedies
Sell
314
225
2,890
1,112
1,289
18.2
18.2
13.2
15.6
23.8
20.1
4.2
3.6
19.2
19.2
2.7
2.3
Ipca labs
Neutral
613
-
7,730
3,303
3,799
15.3
15.3
17.3
19.7
35.4
31.1
3.1
2.8
9.1
9.4
2.5
2.1
Lupin
Buy
1,448
1,809
65,264
15,912
18,644
26.4
26.7
58.1
69.3
24.9
20.9
4.9
4.0
21.4
20.9
4.2
3.4
Sun Pharma
Buy
734
944
176,663
31,129
35,258
30.0
30.9
28.0
32.8
26.2
22.4
4.0
3.3
18.7
18.9
5.3
4.4
Power
Tata Power
Neutral
78
-
20,974
36,916
39,557
17.4
27.1
5.1
6.3
15.2
12.3
1.3
1.2
9.0
10.3
1.6
1.4
NTPC
Neutral
147
-
121,579
86,605
95,545
17.5
20.8
11.8
13.4
12.5
11.0
1.3
1.2
10.5
11.1
2.7
2.8
Power Grid
Neutral
176
-
91,945
25,763
29,762
74.3
73.1
14.8
17.3
11.9
10.2
1.9
1.6
16.9
17.5
7.8
7.5
Real Estate
Prestige Estate
Accumulate
200
210
7,487
4,707
5,105
25.2
26.0
10.3
13.0
19.4
15.4
1.6
1.4
10.3
10.2
2.8
2.4
MLIFE
Buy
432
522
1,771
1,152
1,300
22.7
24.6
29.9
35.8
14.4
12.1
1.1
1.0
7.6
8.6
2.3
1.9
Telecom
Bharti Airtel
Neutral
301
-
120,422
105,086
114,808
34.5
34.7
12.2
16.4
24.7
18.4
1.7
1.6
6.8
8.4
2.1
1.8
Idea Cellular
Neutral
72
-
26,088
40,133
43,731
37.2
37.1
6.4
6.5
11.3
11.2
0.9
0.9
8.2
7.6
1.7
1.4
zOthers
Abbott India
Neutral
4,715
-
10,019
3,153
3,583
14.1
14.4
152.2
182.7
31.0
25.8
152.1
129.9
25.6
26.1
2.9
2.5
Asian Granito
Buy
268
351
806
1,118
1,220
11.8
12.0
13.0
16.0
20.6
16.8
2.0
1.8
9.7
10.7
1.0
0.9
Bajaj Electricals
Buy
258
306
2,604
5,099
5,805
5.6
5.9
11.4
14.6
22.7
17.7
3.0
2.7
13.4
15.1
0.5
0.4
Banco Products (India)
Neutral
223
-
1,595
1,353
1,471
12.3
12.4
14.5
16.3
15.4
13.7
21.2
19.1
14.5
14.6
1.1
120.2
Coffee Day Enterprises
Neutral
226
-
4,649
2,964
3,260
20.5
21.2
4.7
8.0
-
28.2
2.6
2.4
5.5
8.5
2.0
1.8
Ltd
Competent Automobiles Neutral
194
-
119
1,137
1,256
3.1
2.7
28.0
23.6
6.9
8.2
37.3
33.7
14.3
11.5
0.1
0.1
Elecon Engineering
Neutral
67
-
724
1,482
1,660
13.7
14.5
3.9
5.8
17.1
11.5
4.0
3.7
7.8
10.9
0.8
0.7
Finolex Cables
Neutral
438
-
6,699
2,883
3,115
12.0
12.1
14.2
18.6
30.9
23.6
16.4
14.3
15.8
14.6
2.0
1.8
Garware Wall Ropes
Neutral
533
-
1,167
873
938
12.9
13.1
30.9
34.9
17.3
15.3
2.7
2.3
15.7
15.2
1.2
1.1
Goodyear India*
Neutral
804
-
1,854
1,598
1,704
10.4
10.2
49.4
52.6
16.3
15.3
75.1
65.9
18.2
17.0
0.8
119.3
Hitachi
Neutral
1,540
-
4,187
2,081
2,433
8.8
8.9
33.4
39.9
46.1
38.6
37.2
31.0
22.1
21.4
2.0
1.7
HSIL
Neutral
351
-
2,541
2,384
2,515
15.8
16.3
15.3
19.4
23.0
18.1
22.8
19.6
7.8
9.3
1.2
1.1
Interglobe Aviation
Neutral
935
-
33,699
21,122
26,005
14.5
27.6
110.7
132.1
8.5
7.1
50.6
36.1
168.5
201.1
1.6
1.2
Jyothy Laboratories
Neutral
359
-
6,521
1,440
2,052
11.5
13.0
8.5
10.0
42.3
35.9
10.2
9.5
18.6
19.3
4.8
3.4
Kirloskar Engines India
Neutral
350
-
5,064
2,554
2,800
9.9
10.0
10.5
12.1
33.4
28.9
14.0
13.2
10.7
11.7
1.6
1.4
Ltd
Stock Watch
October 18, 2016
Company Name
Reco
CMP
Target
Mkt Cap
Sales ( Čcr )
OPM(%)
EPS (Č)
PER(x)
P/BV(x)
RoE(%)
EV/Sales(x)
(Č)
Price ( Č)
( Č cr )
FY17E
FY18E
FY17E
FY18E
FY17E
FY18E
FY17E
FY18E
FY17E
FY18E
FY17E
FY18E
FY17E
FY18E
zOthers
Linc Pen & Plastics
Neutral
261
-
386
382
420
9.3
9.5
13.5
15.7
19.4
16.6
3.3
2.9
17.1
17.3
1.1
1.0
M M Forgings
Neutral
444
-
536
546
608
20.4
20.7
41.3
48.7
10.8
9.1
60.9
53.9
16.6
17.0
0.8
0.7
Manpasand Bever.
Neutral
711
-
4,065
836
1,087
19.6
19.4
16.9
23.8
42.1
29.9
5.1
4.4
12.0
14.8
4.6
3.5
Mirza International
Buy
93
113
1,124
1,024
1,148
18.0
18.0
6.9
8.0
13.5
11.7
2.3
1.9
16.6
16.2
1.3
1.1
MT Educare
Neutral
131
-
522
366
417
17.7
18.2
9.4
10.8
14.0
12.1
3.1
2.7
22.2
22.3
1.3
1.1
Narayana Hrudaya
Neutral
340
-
6,943
1,873
2,166
11.5
11.7
2.6
4.0
128.5
85.7
7.9
7.1
6.1
8.3
3.8
3.3
Navkar Corporation
Buy
197
265
2,810
408
612
42.9
42.3
6.8
11.5
29.1
17.1
2.0
1.8
6.9
10.5
7.8
5.2
Navneet Education
Neutral
101
-
2,394
1,062
1,147
24.0
24.0
6.1
6.6
16.5
15.2
3.4
3.0
20.6
19.8
2.3
2.2
Nilkamal
Neutral
1,705
-
2,544
1,995
2,165
10.7
10.4
69.8
80.6
24.4
21.2
97.4
84.6
16.6
16.5
1.3
1.1
Page Industries
Neutral
15,738
-
17,554
2,450
3,124
20.1
17.6
299.0
310.0
52.6
50.8
350.5
267.6
47.1
87.5
7.2
5.7
Parag Milk Foods
Neutral
307
-
2,579
1,919
2,231
9.3
9.6
9.5
12.9
32.5
23.7
5.0
4.2
15.5
17.5
1.5
1.3
Quick Heal
Neutral
234
-
1,641
408
495
27.3
27.0
7.7
8.8
30.3
26.7
2.8
2.8
9.3
10.6
3.2
2.6
Radico Khaitan
Neutral
139
-
1,847
1,659
1,802
13.0
13.2
6.3
7.4
21.9
18.8
1.9
1.7
8.6
9.3
1.6
1.4
Relaxo Footwears
Neutral
446
-
5,349
2,085
2,469
9.2
8.2
7.6
8.0
59.0
56.1
22.9
19.5
17.9
18.8
2.7
2.3
S H Kelkar & Co.
Neutral
302
-
4,368
1,036
1,160
15.1
15.0
6.1
7.2
49.5
42.1
5.3
4.8
10.7
11.5
4.1
3.6
Siyaram Silk Mills
Accumulate
1,497
1,714
1,403
1,799
2,040
11.6
11.7
104.9
122.4
14.3
12.2
2.3
2.0
16.4
16.4
1.0
0.9
Styrolution ABS India*
Neutral
612
-
1,075
1,440
1,537
9.2
9.0
40.6
42.6
15.1
14.4
38.5
35.0
12.3
11.6
0.7
0.6
Surya Roshni
Neutral
216
-
948
3,342
3,625
7.8
7.5
17.3
19.8
12.5
11.0
23.8
19.1
10.5
10.8
0.5
0.5
Team Lease Serv.
Neutral
1,006
-
1,720
3,229
4,001
1.5
1.8
22.8
32.8
44.2
30.6
4.7
4.1
10.7
13.4
0.4
0.3
The Byke Hospitality
Neutral
184
-
737
287
384
20.5
20.5
7.6
10.7
24.2
17.2
5.1
4.1
20.7
23.5
2.6
1.9
Transport Corporation of
Neutral
178
-
1,366
2,671
2,911
8.5
8.8
13.9
15.7
12.9
11.4
1.8
1.6
13.7
13.8
0.6
0.6
India
TVS Srichakra
Neutral
3,718
-
2,847
2,304
2,614
13.7
13.8
231.1
266.6
16.1
14.0
417.8
329.0
33.9
29.3
1.2
1.1
UFO Moviez
Neutral
453
-
1,251
619
685
33.2
33.4
30.0
34.9
15.1
13.0
2.1
1.8
13.8
13.9
1.7
1.4
Visaka Industries
Neutral
214
-
340
1,051
1,138
10.3
10.4
21.0
23.1
10.2
9.3
27.5
25.7
9.0
9.2
0.6
0.6
VRL Logistics
Neutral
313
-
2,853
1,902
2,119
16.7
16.6
14.6
16.8
21.5
18.6
4.7
4.1
21.9
22.2
1.6
1.4
Wonderla Holidays
Neutral
407
-
2,299
287
355
38.0
40.0
11.3
14.2
36.0
28.7
5.2
4.5
21.4
23.9
7.7
6.2
Source: Company, Angel Research; Note: *December year end; #September year end; &October year end; Price as on October 17, 2016
Market Outlook
October 18, 2016
Research Team Tel: 022 - 39357800
DISCLAIMER
Angel Broking Private Limited (hereinafter referred to as “Angel”) is a registered Member of National Stock Exchange of India
Limited,Bombay Stock Exchange Limited and Metropolitan Stock Exchange Limited. It is also registered as a Depository Participant with
CDSL and Portfolio Manager with SEBI. It also has registration with AMFI as a Mutual Fund Distributor. Angel Broking Private Limited is a
registered entity with SEBI for Research Analyst in terms of SEBI (Research Analyst) Regulations, 2014 vide registration number
INH000000164. Angel or its associates has not been debarred/ suspended by SEBI or any other regulatory authority for accessing
/dealing in securities Market. Angel or its associates/analyst has not received any compensation / managed or
co-managed public offering of securities of the company covered by Analyst during the past twelve months.
This document is solely for the personal information of the recipient, and must not be singularly used as the basis of any investment
decision. Nothing in this document should be construed as investment or financial advice. Each recipient of this document should make
such investigations as they deem necessary to arrive at an independent evaluation of an investment in the securities of the companies
referred to in this document (including the merits and risks involved), and should consult their own advisors to determine the merits and
risks of such an investment.
Reports based on technical and derivative analysis center on studying charts of a stock's price movement, outstanding positions and
trading volume, as opposed to focusing on a company's fundamentals and, as such, may not match with a report on a company's
fundamentals. Investors are advised to refer the Fundamental and Technical Research Reports available on our website to evaluate the
contrary view, if any.
The information in this document has been printed on the basis of publicly available information, internal data and other reliable
sources believed to be true, but we do not represent that it is accurate or complete and it should not be relied on as such, as this
document is for general guidance only. Angel Broking Pvt. Limited or any of its affiliates/ group companies shall not be in any way
responsible for any loss or damage that may arise to any person from any inadvertent error in the information contained in this report.
Angel Broking Pvt. Limited has not independently verified all the information contained within this document. Accordingly, we cannot
testify, nor make any representation or warranty, express or implied, to the accuracy, contents or data contained within this document.
While Angel Broking Pvt. Limited endeavors to update on a reasonable basis the information discussed in this material, there may be
regulatory, compliance, or other reasons that prevent us from doing so.
This document is being supplied to you solely for your information, and its contents, information or data may not be reproduced,
redistributed or passed on, directly or indirectly.
Neither Angel Broking Pvt. Limited, nor its directors, employees or affiliates shall be liable for any loss or damage that may arise from
or in connection with the use of this information.